The big idea
Motion is described by how far, how fast and how quickly the speed changes. Speed is distance travelled per second. Velocity is speed in a stated direction. Acceleration is the change in velocity per second. Graphs show all of this at a glance.
Key ideas
- Average speed = total distance ÷ total time.
- On a distance–time graph the gradient is the speed. A flat line means the object is not moving.
- On a velocity–time graph the gradient is the acceleration, and the area under the line is the distance travelled.
- A negative acceleration (deceleration) means the object is slowing down.
- Objects falling freely near Earth accelerate at about 9.8 m/s² (often rounded to 10 m/s²).
Equations
| v = s / t | average speed |
| a = (v − u) / t | acceleration |
| v² = u² + 2as | constant acceleration |
Worked example
A car accelerates steadily from rest to 24 m/s in 8.0 s. Find its acceleration and the distance it travels.
- a = (v − u)/t = (24 − 0)/8.0 = 3.0 m/s².
- Distance = area under the velocity–time graph, a triangle: ½ × 8.0 × 24 = 96 m.
- Check: v² = u² + 2as → 576 = 2 × 3.0 × 96 ✓
Common mistakes
- Reading the height of a velocity–time graph as the distance. The distance is the area.
- Mixing units: change km/h to m/s (divide by 3.6) and minutes to seconds before calculating.
Try it yourself
A cyclist slows from 12 m/s to 4 m/s in 4.0 s. Find the acceleration.
Show the answer
a = (4 − 12)/4.0 = −2.0 m/s² (a deceleration of 2.0 m/s²).
Going deeper: GCSE exam level
Exam technique, a longer multi-step worked example and exam-style practice with hidden solutions.
Getting marks from graphs
For a curved graph, find the gradient at a point by drawing a tangent there and using a large triangle. For the area under a velocity–time graph, split it into triangles and rectangles, or count squares if the line is curved. Always quote the units of a gradient: m/s for distance–time, m/s² for velocity–time.
More worked examples
Example 1. A train accelerates from rest to 12 m/s in 4.0 s, travels at 12 m/s for 6.0 s, then brakes to rest in 2.0 s. Find the total distance, the average speed and the deceleration.
- Sketch the velocity–time graph: a triangle, a rectangle and a triangle.
- Areas: ½ × 4.0 × 12 = 24 m; 6.0 × 12 = 72 m; ½ × 2.0 × 12 = 12 m. Total = 108 m.
- Average speed = 108/12.0 = 9.0 m/s.
- Deceleration = 12/2.0 = 6.0 m/s².
Exam-style practice
1. A stone falls from rest for 2.0 s (g = 9.8 m/s²). Find its speed and the distance fallen.
Show the solution
v = 9.8 × 2.0 = 19.6 m/s; distance = average speed × time = 9.8 × 2.0 = 19.6 m.
2. What does a horizontal line mean on (a) a distance–time graph and (b) a velocity–time graph?
Show the solution
(a) The object is stationary. (b) It is moving at constant velocity.
Where this fits in each exam board
| Cambridge IGCSE (0625) | Topic 1: Motion, forces and energy |
| Edexcel International GCSE (4PH1) | Section 1: Forces and motion |
| AQA GCSE (8463) | 4.5 Forces |
4 questions to print or save, with full step-by-step answers at the end.
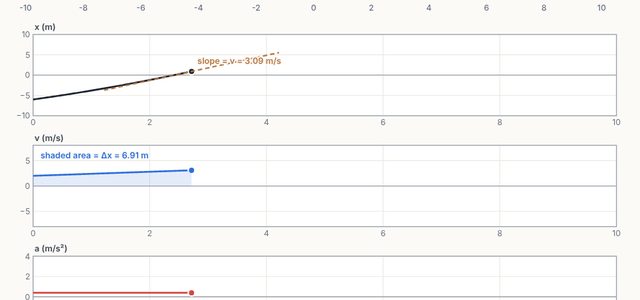
Open the Motion Graphs simulation and test every idea on this page yourself.
Open the simulation →