The big idea
A line plot shows each piece of data as a mark above a number line. An average is one number that stands for the whole set. Volume is the number of unit cubes that fill a solid; for a box it is length × width × height.
Key ideas
- Mode: the value that appears most. Median: the middle value when the data is in order. Range: largest minus smallest.
- Mean: add all the values and divide by how many there are.
- Volume of a rectangular box = length × width × height, in cubic units.
- A shape made of two boxes has a volume equal to the sum of the two.
Equations
| mean = total ÷ number of values | average |
| range = largest − smallest | spread |
| V = l × w × h | volume of a box |
| V = base area × height | another way to see it |
Worked questions: easy, medium, hard
Three questions that climb in difficulty, each solved one step at a time. Try each one before you read the steps.
The numbers of books read by 5 students are 2, 3, 3, 5, 7. Find the mode and the range.
- The value that appears most is 3: mode 3.
- Largest 7, smallest 2.
- Range = 7 − 2 = 5.
For the same data, 2, 3, 3, 5, 7, find the median and the mean.
- The data is in order; the middle (third) value is 3.
- Total: 2 + 3 + 3 + 5 + 7 = 20.
- Mean = 20 ÷ 5 = 4.
A box is 6 cm long, 4 cm wide and 3 cm high. Find its volume. A second box of 2 cm by 4 cm by 3 cm is joined to it. Find the total volume.
- V = 6 × 4 × 3 = 72 cm³.
- Second box: 2 × 4 × 3 = 24 cm³.
- Total: 72 + 24 = 96 cm³.
Common mistakes
- Finding the median without ordering the data.
- Dividing by the wrong number when finding the mean.
- Writing cm² for a volume.
Now you try: easy to hard
Six more questions, two at each level. These are the questions on the worksheet; each solution opens when you are ready.
Easy 1. Find the mode of 4, 6, 6, 7, 9, 6.
Show the step-by-step solution
6 appears three times: 6.
Easy 2. Find the range of 12, 5, 9, 20, 7.
Show the step-by-step solution
20 − 5 = 15.
Medium 3. Find the mean of 6, 8, 10.
Show the step-by-step solution
24 ÷ 3 = 8.
Medium 4. Find the volume of a cube with sides of 3 cm.
Show the step-by-step solution
3 × 3 × 3 = 27 cm³.
Hard 5. A line plot of plant heights (in cm) has marks at 4, 4, 5, 5, 5, 6, 8. Find the median and the mean.
Show the step-by-step solution
Seven values, so the median is the fourth: 5. Total 37, mean = 37 ÷ 7 ≈ 5.3.
Hard 6. A fish tank is 50 cm long, 30 cm wide and 40 cm high. What is its volume in cm³ and in litres (1 L = 1000 cm³)?
Show the step-by-step solution
50 × 30 × 40 = 60,000 cm³ = 60 L.
6 questions to print or save, with full step-by-step answers at the end.
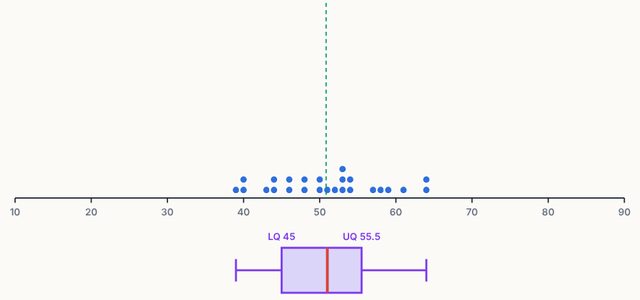
Open the Statistics & Probability Lab simulation and test every idea on this page yourself.
Open the simulation →