The big idea
Many measurements cluster symmetrically around a mean in a bell shape: the normal distribution. Every normal problem is converted to the standard normal Z by standardising, z = (x − μ)/σ, so that one table or calculator function covers them all.
Key ideas
- X ~ N(μ, σ²): mean μ, standard deviation σ. About 68% of values lie within 1σ of the mean and 95% within 2σ.
- Standardise with z = (x − μ)/σ. Sketch the curve and shade the area you want.
- To find an unknown μ or σ, work backwards from a probability to a z-value.
- The mean of a sample of size n has standard deviation σ/√n.
- A binomial with large n can be approximated by a normal; use a continuity correction.
Equations
| z = (x − μ)/σ | standardising |
| P(X < x) = Φ(z) | standard normal |
| X̄ ~ N(μ, σ2/n) | sample mean |
| B(n, p) ≈ N(np, np(1 − p)) | normal approximation |
Worked questions: easy, medium, hard
Three questions that climb in difficulty, each solved one step at a time. Try each one before you read the steps.
X ~ N(50, 10²). Find P(X < 65).
- Standardise: z = (65 − 50)/10 = 1.5.
- P(X < 65) = Φ(1.5).
- = 0.9332.
For the same distribution, find P(40 < X < 65).
- z-values: (40 − 50)/10 = −1 and (65 − 50)/10 = 1.5.
- Φ(1.5) = 0.9332 and Φ(−1) = 1 − 0.8413 = 0.1587.
- 0.9332 − 0.1587 = 0.7745.
X ~ N(μ, 5²) and P(X > 60) = 0.1. Find μ.
- P(X < 60) = 0.9, and Φ(z) = 0.9 gives z = 1.2816.
- (60 − μ)/5 = 1.2816.
- 60 − μ = 6.408.
- μ = 53.6.
Common mistakes
- Using the variance in place of the standard deviation when standardising.
- Reading Φ(z) when the question wants the upper tail.
- Leaving out the continuity correction in a normal approximation.
Now you try: easy to hard
Six more questions, two at each level. These are the questions on the worksheet; each solution opens when you are ready.
Easy 1. X ~ N(70, 8²). Find the z-value for x = 82.
Show the step-by-step solution
z = (82 − 70)/8 = 1.5.
Easy 2. Find P(Z < −1).
Show the step-by-step solution
By symmetry, 1 − Φ(1) = 1 − 0.8413 = 0.1587.
Medium 3. Heights are N(170, 6²) in cm. Find the probability that a person is taller than 179 cm.
Show the step-by-step solution
z = 1.5. P(Z > 1.5) = 1 − 0.9332 = 0.0668.
Medium 4. Scores are N(100, 15²). What score is exceeded by only the top 5%?
Show the step-by-step solution
Φ(z) = 0.95 gives z = 1.645. x = 100 + 1.645 × 15 = 124.7.
Hard 5. X ~ B(100, 0.5). Use a normal approximation to find P(X ≥ 60).
Show the step-by-step solution
Approximate by N(50, 25). With continuity correction: z = (59.5 − 50)/5 = 1.9. P(Z > 1.9) = 0.0287.
Hard 6. A machine is set to a mean of 50 with σ = 4. A sample of 25 has mean 51.8. Test at the 5% level whether the mean has increased.
Show the step-by-step solution
H₀: μ = 50, H₁: μ > 50. Standard error = 4/√25 = 0.8. z = 1.8/0.8 = 2.25 > 1.645, so reject H₀: there is evidence the mean has increased.
6 questions to print or save, with full step-by-step answers at the end.
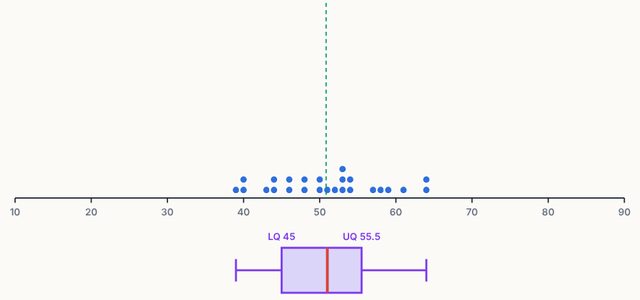
Open the Statistics & Probability Lab simulation and test every idea on this page yourself.
Open the simulation →