The big idea
Statistics summarises data. An average (mean, median or mode) gives a typical value, and a measure of spread (range or interquartile range) shows how varied the data is. To compare two sets of data you need one of each.
Key ideas
- Mean = total ÷ number of values. Median = middle value when in order. Mode = most common.
- For grouped data, estimate the mean using the midpoint of each class.
- The interquartile range (UQ − LQ) measures the spread of the middle half and ignores outliers.
- In a histogram the area of a bar gives the frequency: frequency density = frequency ÷ class width.
Equations
| mean = Σfx/Σf | from a frequency table |
| IQR = UQ − LQ | interquartile range |
| frequency density = frequency ÷ class width | histograms |
| range = largest − smallest | spread |
Worked questions: easy, medium, hard
Three questions that climb in difficulty, each solved one step at a time. Try each one before you read the steps.
Find the mean, median, mode and range of 3, 5, 5, 6, 8, 9.
- Mean: total 36, divided by 6 = 6.
- Median: the middle pair is 5 and 6, so 5.5.
- Mode 5; range 9 − 3 = 6.
Estimate the mean from this table: 0–10 (frequency 4), 10–20 (frequency 10), 20–30 (frequency 6). State the modal class.
- Use midpoints 5, 15 and 25.
- Σfx = 4 × 5 + 10 × 15 + 6 × 25 = 20 + 150 + 150 = 320.
- Σf = 20, so the estimated mean = 320 ÷ 20 = 16.
- The modal class has the highest frequency: 10–20.
Find the median, quartiles and interquartile range of 2, 4, 5, 7, 8, 10, 12, 13, 15, 18, 21. Then find the frequency density for a class 10–30 with frequency 16.
- There are 11 values, so the median is the 6th: 10.
- Lower quartile: the 3rd value, 5. Upper quartile: the 9th value, 15.
- IQR = 15 − 5 = 10.
- Frequency density = 16 ÷ 20 = 0.8.
Common mistakes
- Finding the median without putting the data in order.
- Using class boundaries instead of midpoints for an estimated mean.
- Reading the height of a histogram bar as the frequency.
Now you try: easy to hard
Six more questions, two at each level. These are the questions on the worksheet; each solution opens when you are ready.
Easy 1. Find the mean of 4, 7, 9, 12, 13.
Show the step-by-step solution
Total 45 ÷ 5 = 9.
Easy 2. Find the median and range of 11, 3, 8, 15, 6.
Show the step-by-step solution
In order: 3, 6, 8, 11, 15. Median 8, range 12.
Medium 3. The mean of five numbers is 12. Four of them are 10, 9, 15 and 14. Find the fifth.
Show the step-by-step solution
Total must be 60. 60 − 48 = 12.
Medium 4. Scores 1, 2, 3, 4 have frequencies 3, 5, 8, 4. Find the mean score.
Show the step-by-step solution
Σfx = 3 + 10 + 24 + 16 = 53. Σf = 20. Mean = 2.65.
Hard 5. In a histogram the class 20–50 has frequency 18, and the class 50–60 has frequency density 2.4. Find the frequency density of the first class and the frequency of the second.
Show the step-by-step solution
18 ÷ 30 = 0.6. 2.4 × 10 = 24.
Hard 6. Class A has 12 students with mean mark 60. Class B has 18 students with mean mark 70. Find the mean for all 30.
Show the step-by-step solution
Totals: 720 and 1260. (720 + 1260) ÷ 30 = 66 (not 65, because the classes are different sizes).
6 questions to print or save, with full step-by-step answers at the end.
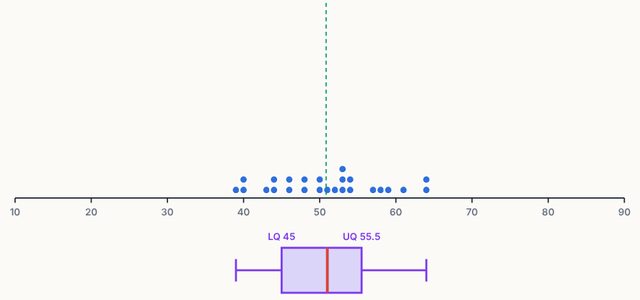
Open the Statistics & Probability Lab simulation and test every idea on this page yourself.
Open the simulation →