The big idea
The binomial distribution models the number of successes in a fixed number of independent trials, each with the same probability of success. It is also the basis of a hypothesis test: is a result surprising enough to doubt the assumed probability?
Key ideas
- Variance is the mean of the squared deviations; standard deviation is its square root.
- X ~ B(n, p) needs a fixed n, two outcomes, constant p and independent trials.
- P(X = r) = C(n, r) pr (1 − p)n−r. The mean is np.
- In a hypothesis test, assume H₀, find the probability of a result at least as extreme as the one observed, and compare it with the significance level.
Equations
| P(X = r) = C(n, r) pr (1 − p)n−r | binomial probability |
| E(X) = np, Var(X) = np(1 − p) | mean and variance |
| σ2 = Σ(x − x̄)2/n | variance |
| P(A ∪ B) = P(A) + P(B) − P(A ∩ B) | addition rule |
Worked questions: easy, medium, hard
Three questions that climb in difficulty, each solved one step at a time. Try each one before you read the steps.
X ~ B(5, 0.5). Find P(X = 2).
- P(X = 2) = C(5, 2) × 0.52 × 0.53.
- C(5, 2) = 10 and 0.55 = 1/32.
- 10/32 = 0.3125.
X ~ B(10, 0.2). Find P(X = 0), P(X ≥ 1) and the mean.
- P(X = 0) = 0.810 = 0.107.
- P(X ≥ 1) = 1 − P(X = 0) = 0.893.
- Mean = np = 10 × 0.2 = 2.
A coin is tossed 20 times and lands heads 15 times. Test at the 5% level whether the coin is biased toward heads.
- H₀: p = 0.5. H₁: p > 0.5. Under H₀, X ~ B(20, 0.5).
- P(X ≥ 15) = [C(20,15) + C(20,16) + … + C(20,20)]/220 = (15504 + 4845 + 1140 + 190 + 20 + 1)/1 048 576.
- = 21 700/1 048 576 = 0.0207.
- 0.0207 < 0.05, so reject H₀: there is evidence that the coin is biased toward heads.
Common mistakes
- Using a binomial model when the trials are not independent.
- Finding P(X = 15) instead of P(X ≥ 15) in a test.
- Saying a test "proves" the hypothesis.
Now you try: easy to hard
Six more questions, two at each level. These are the questions on the worksheet; each solution opens when you are ready.
Easy 1. Find the variance and standard deviation of 2, 4, 6, 8.
Show the step-by-step solution
Mean 5. Squared deviations 9, 1, 1, 9, mean 5. Variance 5, standard deviation 2.24.
Easy 2. A and B are independent with P(A) = 0.4 and P(B) = 0.5. Find P(A ∩ B) and P(A ∪ B).
Show the step-by-step solution
P(A ∩ B) = 0.4 × 0.5 = 0.2. P(A ∪ B) = 0.4 + 0.5 − 0.2 = 0.7.
Medium 3. X ~ B(6, 1/3). Find P(X = 2).
Show the step-by-step solution
C(6, 2)(1/3)2(2/3)4 = 15 × (1/9) × (16/81) = 240/729 = 0.329.
Medium 4. X ~ B(8, 0.25). Find the mean and variance.
Show the step-by-step solution
Mean = 8 × 0.25 = 2. Variance = 8 × 0.25 × 0.75 = 1.5.
Hard 5. X ~ B(4, 0.3). Find P(X ≤ 1).
Show the step-by-step solution
P(0) = 0.74 = 0.2401. P(1) = 4 × 0.3 × 0.73 = 0.4116. Total 0.6517.
Hard 6. A random variable has P(X = x) = kx for x = 1, 2, 3, 4. Find k and E(X).
Show the step-by-step solution
k(1 + 2 + 3 + 4) = 1, so k = 1/10. E(X) = (1 + 4 + 9 + 16)/10 = 3.
6 questions to print or save, with full step-by-step answers at the end.
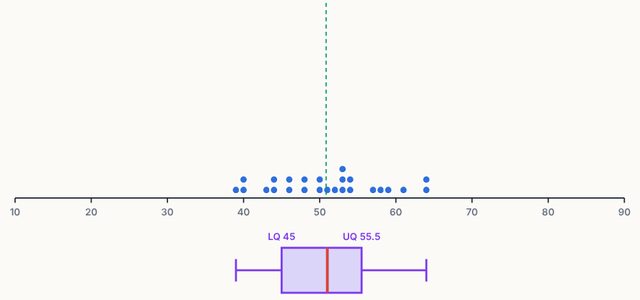
Open the Statistics & Probability Lab simulation and test every idea on this page yourself.
Open the simulation →